Ontology Monitor: An AI Intelligence Department That Argues With Itself
· Side Projects · 10 min read
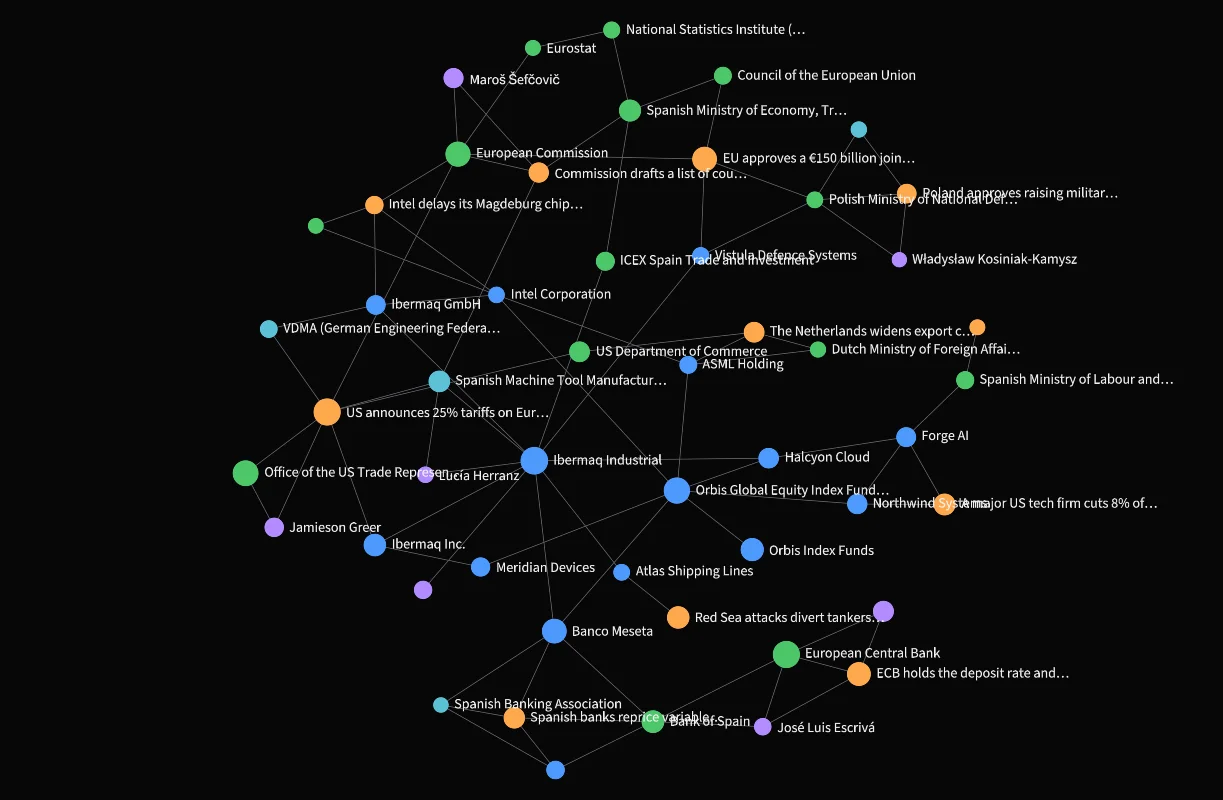
Most AI research tools answer the question you asked with the first plausible story they find. That is exactly the failure mode I did not want. So I built Ontology Monitor: a self-hosted engine that watches open sources for one question, notices what does not fit what it expected, and makes several explanations compete against the evidence before it commits to an answer. It runs every week, keeps a living report, and tells me what changed since last time.
This post is how it works, what went wrong while building it, and why I now trust it more than a chat window for questions that matter to me.
A note on the screenshots: they come from the project’s demo mode, which runs on fictional data about a fictional household in Madrid. The numbers, companies and events in them are invented to show the interface; they are not forecasts. I translated the demo data to English for this post, but the interface labels are in Spanish because that is the language I think in.
The question that started it: “how does the world reach my house?”
Some questions are not searchable. “What will the 12-month Euribor do before my mortgage resets in March?” depends on the European Central Bank, on inflation, on energy, on defense spending, and on whatever happens in the Red Sea this month. “Will US tariffs on European machinery hit hiring at an exporting company in Madrid?” depends on trade policy, orders, and the job market for engineers.
A chat assistant gives you a confident paragraph. A news feed gives you forty articles and no answer. What I wanted was something closer to an intelligence department: a team that keeps watching, separates facts from guesses, says how sure it is, and comes back when the picture changes.
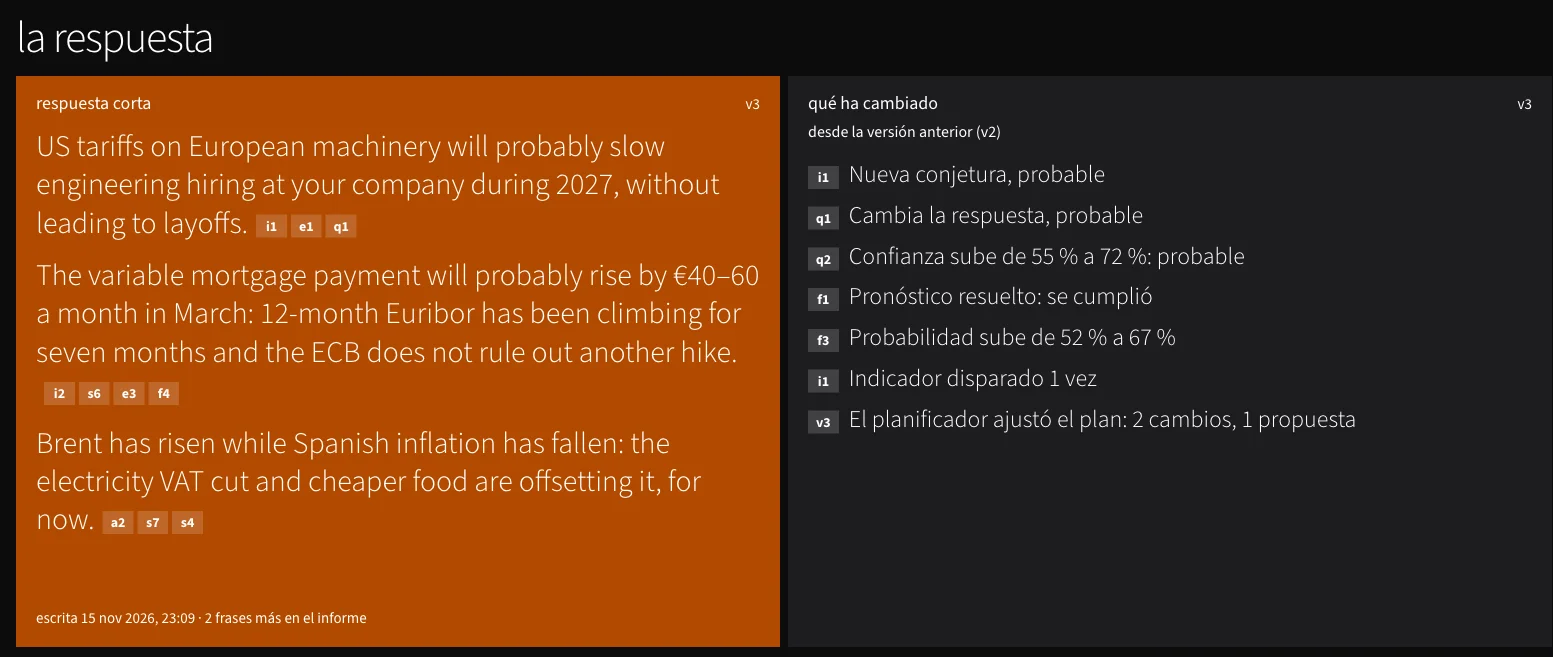
A mission is a plan, not a prompt
Everything in Ontology Monitor starts with a mission: one question in plain language, plus what you have at stake. In the demo: “How does what happens in the world affect us? I’m a software engineer at an exporting company in Madrid, we have a variable-rate mortgage and we save in a global index fund.”
A planner model turns that into a plan I can read and edit before anything runs:
- Focus: the things at stake (the job, the mortgage, the savings).
- Drivers of change: lasting forces worth following, each with its own news queries and languages (tariffs, ECB policy, European rearmament, energy).
- Sub-questions the final answer depends on.
- Expectations: causal claims the engine should check, like “if the ECB raises rates, the mortgage payment goes up within 90 days”.
- Series: official statistics to measure, pulled straight from Eurostat, the ECB, INE, FRED, the OECD, Indeed Hiring Lab and others (57 in the catalog today).
- Forecasts: yes or no questions about the future with a resolution date and a criterion.
- Budget: a cost cap per run and per month. Nothing runs until I approve the plan.
The engine is generic on purpose. A mission about a household, one about a market, and one about public tenders run on the same code; only the plan changes.
How a run works
Each run has two halves: collecting, then thinking.
plan (approved)
  → root investigation: source queries, web queries, one news task per driver
  → best-first loop over a budgeted frontier:
       investigate an entity → extract facts with their source and quote
       → resolve duplicates → score relevance (0–1) → back to the frontier
  → close phase: series, events, causal layer, anomalies, implications
  → each question becomes a test: research, then a verdict per hypothesis
  → living report: a new version, with what changed since the last one
  → replanner adjusts the collection for the next run
Facts with receipts
Everything collected becomes a graph built on  FollowTheMoney, the data model OpenSanctions uses for investigations. Companies, people, public bodies, contracts, grants and events are entities, and relations like ownership or employment are entities too. The key property is that every value is a statement that carries its source URL and, when there is one, the literal quote that supports it. Nothing enters the graph as “the model said so”.
Collection uses 11 concept tools over 18 providers: EU tenders (TED), the Spanish procurement platform, the Spanish company gazette (BORME), grants, EU-funded projects, the legal entity registry (GLEIF), news, and a web gateway I run as a separate service with fallback chains between search APIs.
The graph at the top of this post is the demo mission’s: 51 entities and 81 relations, from the European Commission and the ECB to a fictional machinery exporter, the banks that sell variable mortgages, and the fund the savings sit in.
Looking for what does not fit
This is the part I care about most. The engine reasons by abduction: the kind of inference that goes from a surprising observation to the best explanation for it ( Stanford Encyclopedia of Philosophy has a good introduction). In practice, the close phase of each run looks for two kinds of surprise, both detected by code, not by a model:
- Broken expectation: the plan said “when A goes up, B goes up”, both are measured, A moved at least 5% in a year, and B moved the other way.
- Unexplained move: a series moves unusually (a z-score of at least 2.5 against its own history) and no recent event explains it.
In the demo, the plan expected inflation to follow oil. Then Brent rose almost 12 dollars a barrel in a year while Spanish inflation fell 1.3 points. That is a broken expectation, and the engine went looking for why:
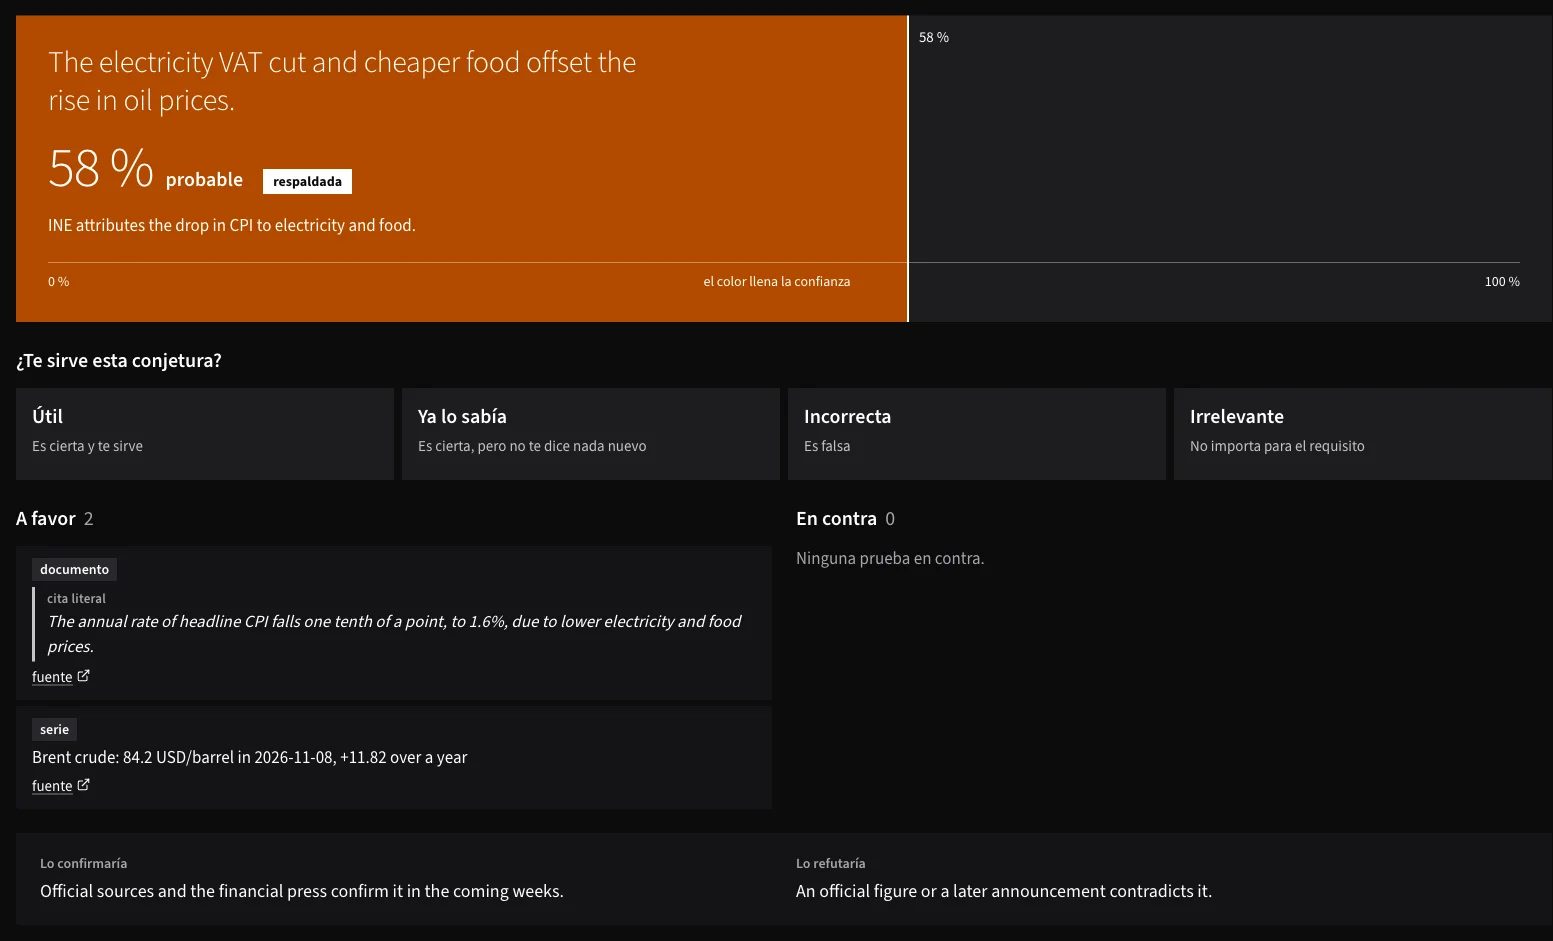
The answer that survived (a VAT cut on electricity and cheaper food offset the oil) comes with the literal sentence from the statistics office that supports it, not a paraphrase. And when nothing survives, the engine says so: “the evidence did not support any explanation” is a valid answer, and a much better one than an invented story.
Rival hypotheses, then a verdict
Every question (a sub-question, an anomaly, an implication, a causal mechanism or a forecast) goes through the same machinery. A model proposes up to four rival hypotheses, each with a prior and a prediction that would show it true. The engine then runs a test: it researches each prediction against the sources, and a verdict assigns each hypothesis a posterior and a status: supported, refuted or inconclusive. The standing hypothesis with the highest posterior becomes the conjecture, the current answer.
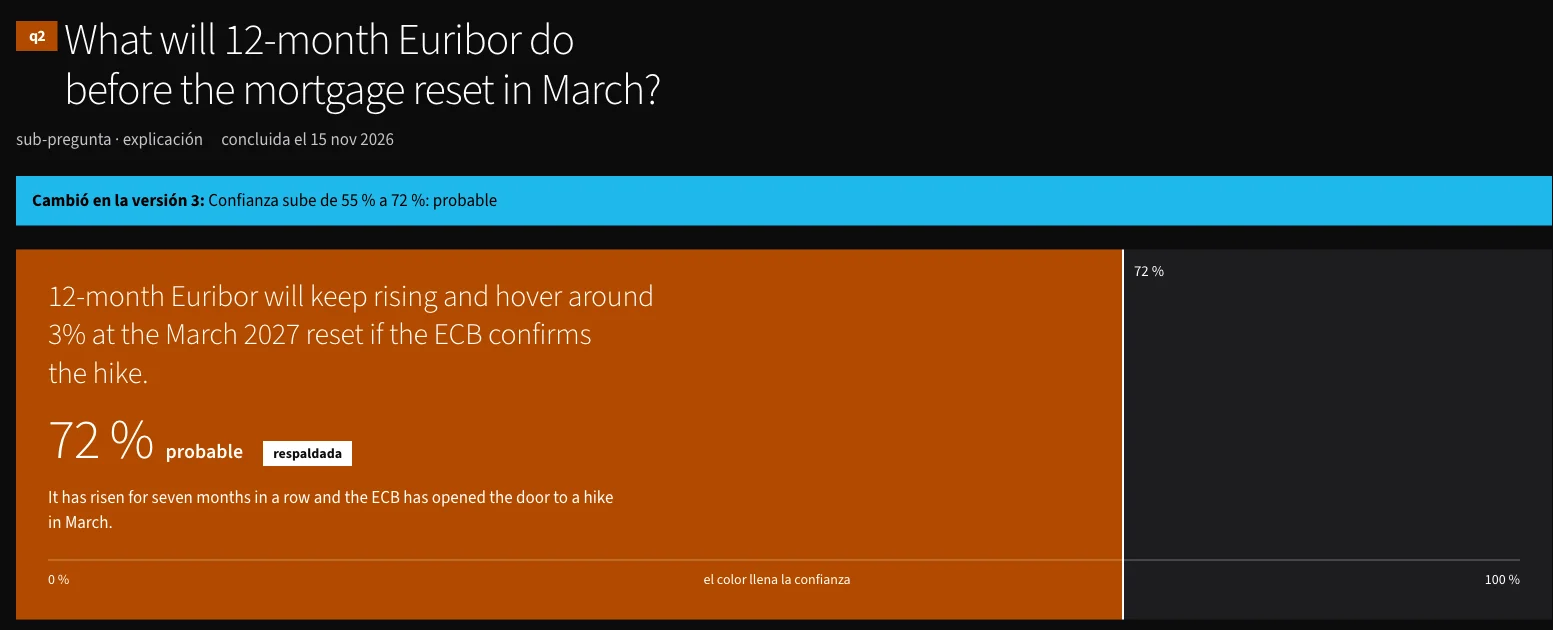
Confidence is shown with the estimative words from the US intelligence community’s analytic standard,  ICD 203: “almost no chance”, “unlikely”, “roughly even chance”, “likely”, “almost certain”. Every conjecture lists its evidence for and against, and what would confirm or refute it.
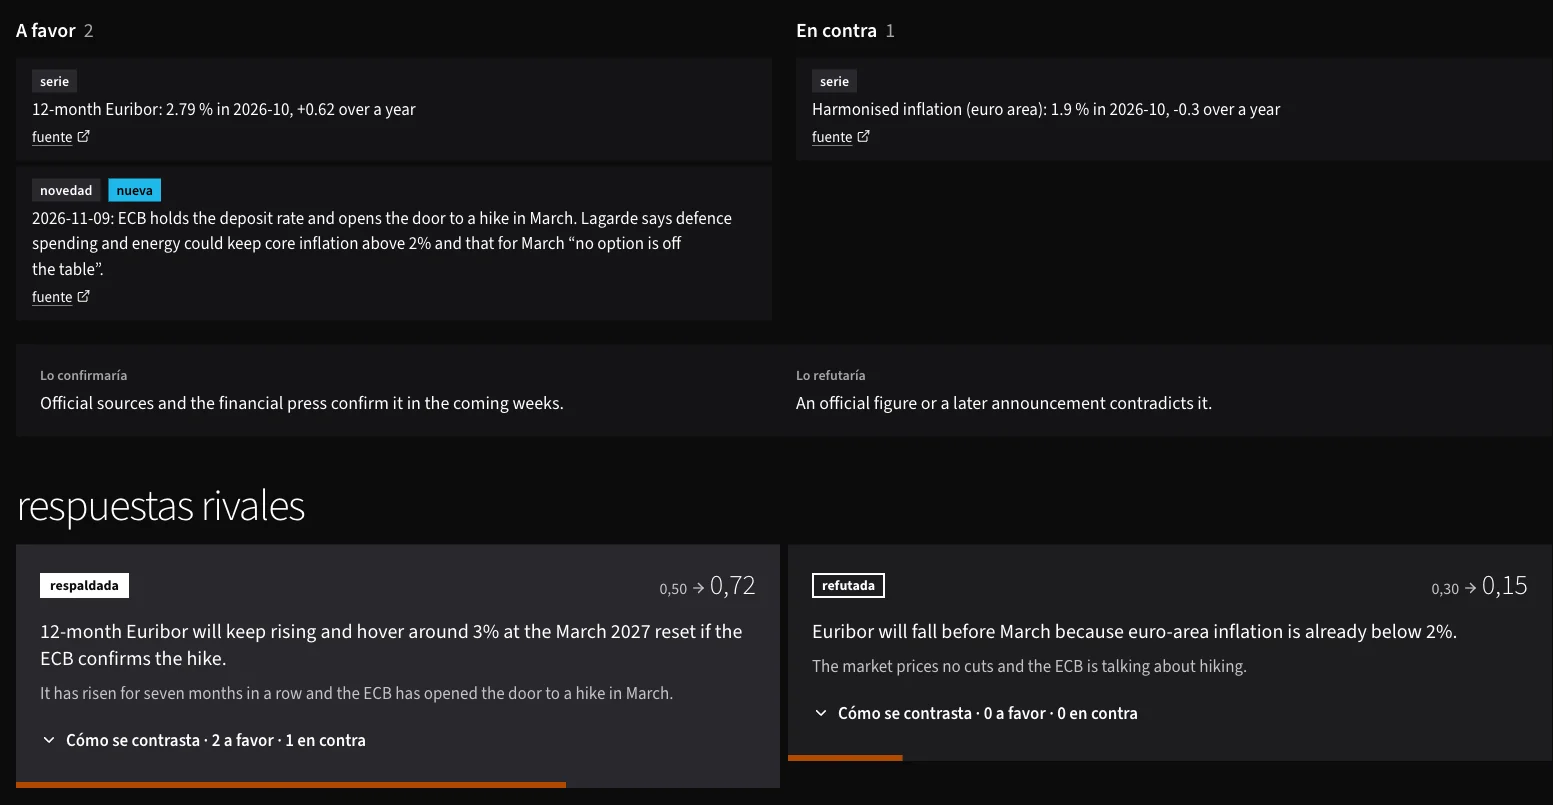
When a sub-question is asked again in a later run, the previous answer has to compete again with its own confidence as prior. That is how the report can say whether the old answer still stands, was refuted, or was replaced.
From the world to what you have at stake
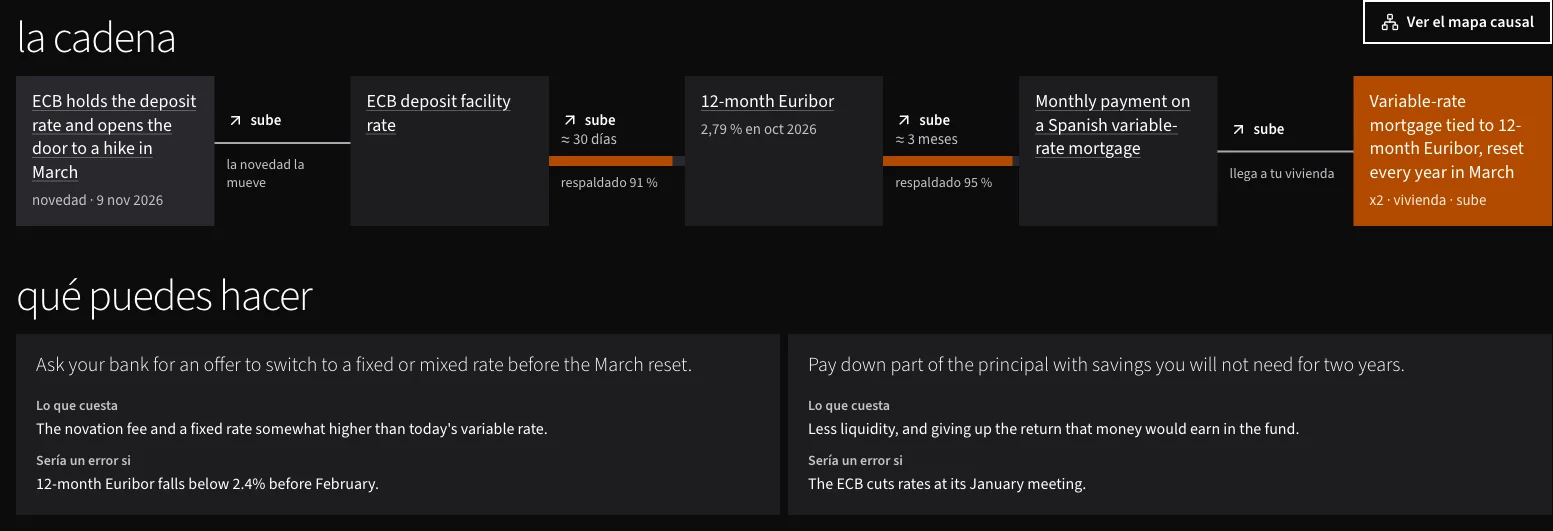
A causal layer links variables (the Euribor, demand for software engineers, exports to the US) with mechanisms, each tested once and shared between missions. When an event pushes a variable, the engine follows mechanisms that have not been refuted, up to three links, until it reaches something in the focus. That path becomes an implication: “the ECB keeps rates and opens the door to a hike in March” can reach “variable mortgage tied to the 12-month Euribor, reset in March”. Implications that survive their own test come with possible moves: what to do, what it costs, and when it would be the wrong call.
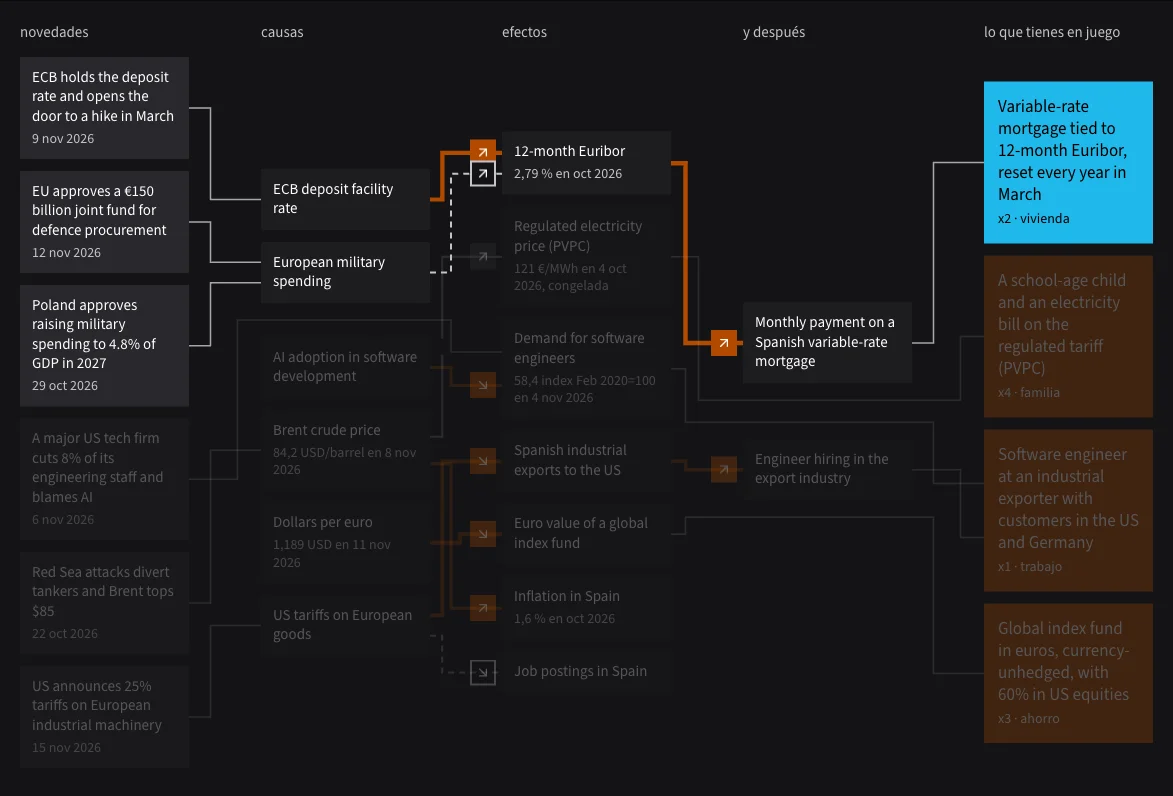
Open one implication and you get the chain link by link, with how strongly each mechanism held up in its test, and the moves:
Forecasts that get graded
Forecasts are the honesty check. Each run updates their probability with new events, and on the resolution date the engine researches the outcome and settles it only with a quote found literally in a document. Then it computes a Brier score (lower is better; 0.25 is what you get by saying 50% to everything) and, when a  Polymarket market exists on the same question, compares itself against the market.
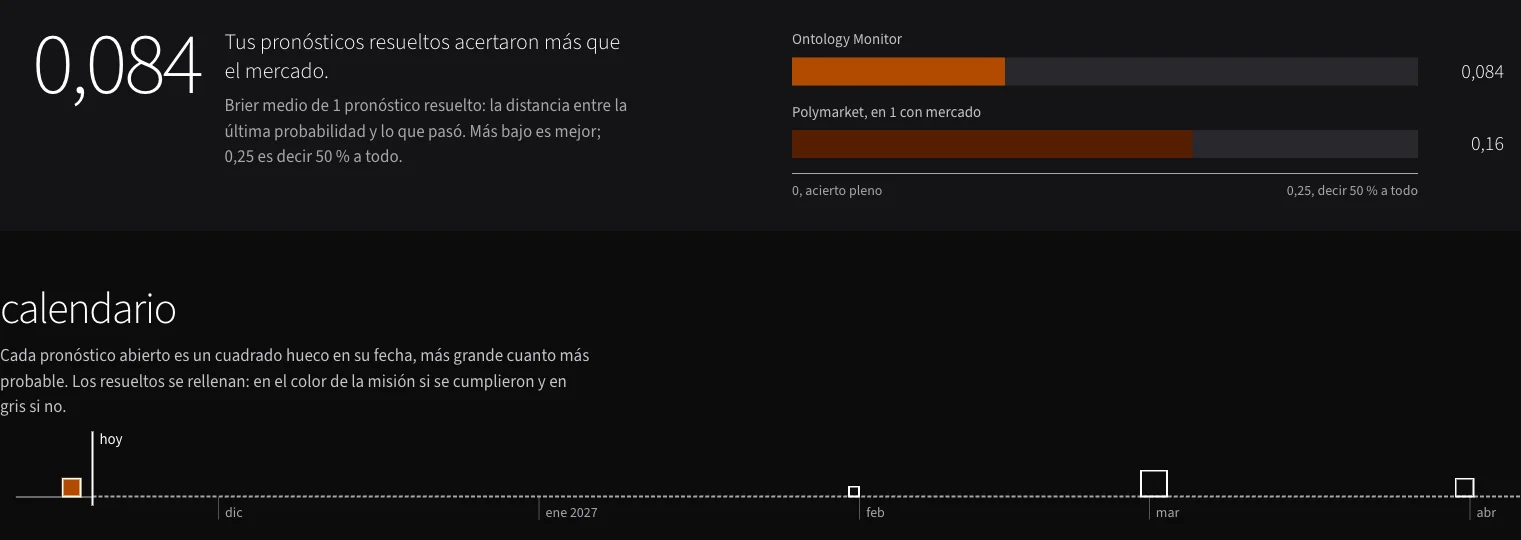
A tool that never gets graded can be confidently wrong forever. This one keeps a score.
How it is built
The stack is deliberately boring: Postgres as the single source of truth, a FastAPI backend, Python workers on  Procrastinate (a job queue on Postgres), and a React frontend with
 Sigma.js for the graph. Models go through
 OpenRouter with one model per role (planner, researcher, extractor, decider, verdict, report), and every call reserves its cost before it runs, so a mission cannot overspend its cap.
It also serves an MCP server, so I can read missions from Claude Code: reports, conjectures, entities, the path between two companies, the source document behind a fact. Half my use of it is asking an agent “what changed in my missions this week, and is any of it wrong?”
I started the repository on 11 November 2026 and it had 113 commits a week later. A real run on a market question costs me between 1.30 and 2.10 euros and investigates 30 entities in depth, with a few thousand entities collected around them.
What went wrong (and what it taught me)
The first real runs were humbling, in useful ways:
- A question cut in half. The planner split one sub-question at a comma, so the plan had a “q5” that ended mid-sentence and a “q5b” that started in the middle of one. Two halves, two different confidences for one question. Validating the shape of a plan is not the same as validating that it makes sense.
- Quotes that were cookie banners. Some evidence cited the first 300 characters of the page, which turned out to be the cookie notice or the site menu. The verdict was right; the receipt was garbage. A quote has to be the passage that supports the claim, or it is not a receipt.
- The right number, the wrong continent. One run answered a European question with a striking US salary figure as its headline. Every fact was sourced, and the conclusion still leaned on data from the wrong market. Provenance tells you where a fact came from, not whether it applies.
- A provider rule that silently blocked a model. A routing preference allowed only one provider, so the first calls of three roles asked for a model that provider does not serve and failed with a 404 before the run went on with another model. Partial runs need to say why they are partial.
None of these were model failures in the usual sense. They were engine failures that a model made visible, which is the best argument I know for showing your evidence on screen.
How it actually helps me
I use it for questions where the honest answer is “it depends on five things that keep moving”: side-project markets, where demand is going, and how news reaches decisions I have to make. The value is not that it is smarter than me. It is that it does the boring part every week (reading, sourcing, measuring) and hands me a short answer with its doubts attached, plus a list of what changed.
Three habits changed:
- I rate conjectures. “Useful”, “I knew it”, “wrong” or “irrelevant”. A sub-question rated wrong is asked again in the next run, with my note as a lead.
- I read the “against” column first. If the evidence against is thin, the confidence is probably inflated.
- I trust anomalies more than answers. The most valuable output is often “this moved and nobody knows why”, because that is where I would never have looked.
Quick Takeaways
- Write the plan first and approve it: requirement, focus, drivers, sub-questions, expectations, series, forecasts and budget.
- Keep facts with their source and literal quote; a model’s note is an inference and should look like one.
- Find surprises with code (broken expectations, unexplained moves) and explain them with rival hypotheses.
- Show confidence in estimative words, with the evidence against next to the evidence for.
- Grade forecasts against reality and against a market, or you will never know if the engine is any good.
FAQs
Q: Is the data in the screenshots real?
No. The screenshots come from the demo mode, with an invented household and invented numbers. Real missions look the same but run on real sources.
Q: Why not just use a deep research tool?
Deep research tools write a report once. I wanted something that keeps watching, remembers what it said, tests its own answer again when new evidence arrives, and gets graded on its forecasts.
Q: Which model does it use?
One per role, through OpenRouter, and I can change them per mission. Most of the volume (extraction, research, scoring) runs on cheap fast models; the cost cap matters more than the model choice.
If you had a weekly analyst watching the world for one question about your life, which question would you give it?